Downrigger Blowback: True Depth at 80-180ft (With Chart)
⏱ 13 min read
Downrigger blowback forces your trolling presentation 10% to 35% shallower than your mechanical line counter indicates when targeting fish between 80 and 180 feet. Hydrodynamic water resistance acts on both the cannonball and submerged cable, swinging the weight rearward and curving the line into an upward arc. At a standard trolling speed of 2.4 knots, deploying 140 feet of 0.031-inch wire with a 12-pound spherical ball yields an actual vertical running depth of only 111 feet, leaving your lure 29 feet above the target zone. Compensating for this depth deficit requires matching your boat speed and current vectors to heavier hydrodynamic weights or low-drag braided line.
Key Takeaways
- A 10-pound round ball trolled at 2.4 knots loses 22 feet of vertical depth at 100 feet of deployed wire and 36 feet at 140 feet.
- Water drag on submerged downrigger line increases exponentially with the square of boat speed rather than linearly.
- At depths past 120 feet, vibrating downrigger cable accounts for 65% to 75% of total system drag, not the lead cannonball.
- Replacing standard 0.036-inch stainless steel wire with 0.024-inch 200-pound test braided line reduces hydrodynamic drag by 35% to 40%.
- A 15-pound or 20-pound finned torpedo weight cuts vertical displacement nearly in half compared to a standard spherical ball.
Table of Contents
- Hydrodynamic Forces That Push Downrigger Weights Shallow at Speed
- Transom Trigonometry and Cable Catenary Bow Calculation
- Rigging Hardware Changes That Cut Hydrodynamic Blowback by 40%
- The Master Downrigger Blowback Correction Chart (80 to 180 Feet)
- Field Action Scenarios for Deep-Trolling Calibration
- Sources & Further Reading
Hydrodynamic Forces That Push Downrigger Weights Shallow at Speed
Hydrodynamic drag pushes your downrigger ball backwards and upward through the water column because fluid drag scales quadratically with forward velocity. When your boat accelerates from 1.8 knots to 2.8 knots, forward speed increases by a factor of 1.55, which surges total horizontal drag force by 142%. This upward pressure lifts a 10-pound round weight deployed on 120 feet of cable from an actual operating depth of 104 feet at 1.8 knots up to barely 74 feet at 3.0 knots. In narrow thermoclines where pelagics hold in tight bands, that 30-foot vertical swing pulls your terminal tackle completely above feeding fish.
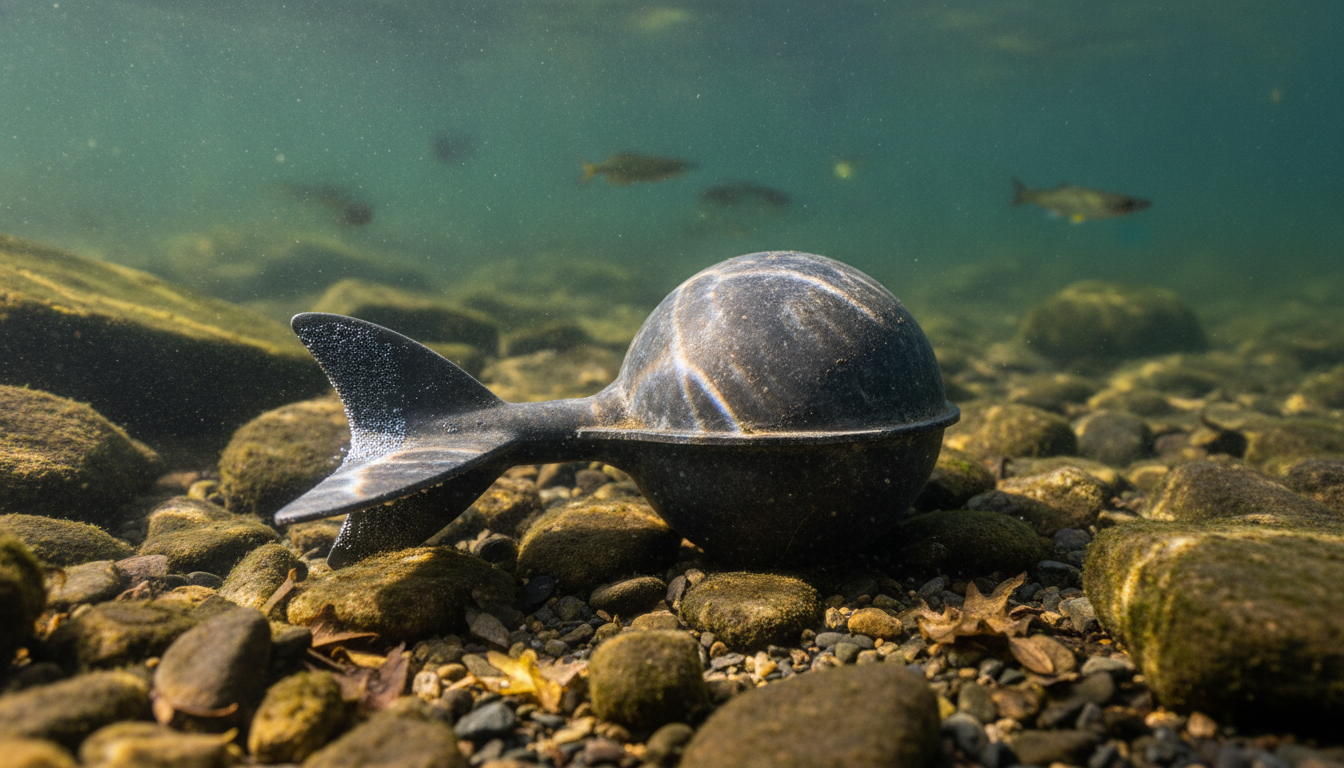
The geometric profile of your lead cannonball controls its coefficient of drag. Research published in Sighard F. Hoerner’s engineering volume Fluid-Dynamic Drag documents that a smooth spherical shape maintains a drag coefficient of approximately 0.47 in turbulent flow. A spherical ball punches a wide wake through the water, creating suction behind the lead that pulls it toward the surface.
HYDRODYNAMIC PROFILES AND DRAG COEFFICIENTS
-------------------------------------------
Round Cannonball:
(   ) ---> Cd ~ 0.47 (High Drag / Rapid Lift)

Finned Pancake:
[ | ] ---> Cd ~ 0.28 (Moderate Drag / Directional)

Finned Torpedo:
<==>  ---> Cd ~ 0.14 (Low Drag / High Tracking Stability)
Finned pancake weights—such as those manufactured by Scotty Fishing Products—cut that frontal drag coefficient down to roughly 0.28 by flattening the lateral surface. The planar fin tracks straight through steady tracking lanes. If dynamic cross-currents hit your transom, however, pancake weights can yaw 5 to 10 degrees off-center, transforming the flat profile into a hydrofoil kite that planes sideways. Hydrodynamic torpedo shapes like those made by Cannon Downriggers maintain a symmetrical low-drag profile with a drag coefficient between 0.12 and 0.15, shedding water evenly regardless of minor current shifts. When targeting deep-water apex species where heavy sinker dynamics matter, understanding ball profiles mirrors the hydrodynamics seen in our guide to High-Speed Wahoo Sinker Chart (16oz to 96oz Depth Guide).
At target depths exceeding 100 feet, downrigger wire creates more resistance than the weight itself. A 150-foot spool of standard 0.032-inch 1×7 stainless steel cable presents 57.6 square inches of exposed frontal area. A standard 10-pound lead ball presents only 11.9 square inches. Fluid mechanics data from the MIT Department of Mechanical Engineering indicates that trailing tow cables generate vortex shedding, creating microscopic vibrations known as cable strum. This vortex-induced vibration pushes the effective drag coefficient of submerged wire from a baseline 1.0 up to 2.1, turning the upper 100 feet of wire into a virtual sea anchor.
⚠️ Anti-Pattern: The Heavy Ball Trap
What it looks like: Stacking a 16-pound round lead ball onto standard 0.036-inch stranded steel downrigger cable to eliminate severe blowback at 150 feet, rather than reducing cable surface area or swapping to a hydrodynamic shape.
Why it’s tempting: Adding weight feels like the fastest fix at the dock because extra mass pulls down harder on the boom pulley while idling.
What it costs: Beyond 100 feet of depth, cable surface area generates over 65% of the system’s total drag. Extra lead mass strains downrigger motors, bends extended booms, and accelerates gunwale fatigue while failing to fix the massive parabolic belly in the vibrating steel wire.
Do instead: Replace thick wire with 0.024-inch braided UHMWPE fiber line and switch to a finned torpedo weight. This slashes hydrodynamic resistance by 35% without overloading your downrigger motor or structural mounts.
Transom Trigonometry and Cable Catenary Bow Calculation
Cable catenary curvature causes simple transom-angle trigonometry to overestimate actual downrigger depth by 10% to 20% past 100 feet. When you measure a 25-degree wire departure angle with an inclinometer at the boom tip, right-triangle math suggests multiplying line-out by the cosine of the angle. For 120 feet of wire, straight-line math predicts a depth of 108.8 feet (120 multiplied by 0.906). Empirical measurements show the actual depth is closer to 98.2 feet.
Submerged cables do not travel through water in straight lines. Documentation published by the U.S. Naval Sea Systems Command demonstrates that towed cables follow a parabolic arc. Horizontal drag along the full length of the wire continuously pushes the center of the line rearward. The cable angle becomes progressively steeper near the surface and flattens out closer to the cannonball.
| Line Out (ft) | Ball Weight (lb) | Departure Angle (°) | Trig Estimate (ft) | Actual Depth (ft) | Catenary Error (ft) |
|---|---|---|---|---|---|
| 100 | 12 | 20° | 94.0 | 88.5 | -5.5 |
| 120 | 12 | 25° | 108.8 | 98.2 | -10.6 |
| 150 | 12 | 30° | 129.9 | 114.1 | -15.8 |
| 150 | 16 | 22° | 139.1 | 128.4 | -10.7 |
| 180 | 16 | 28° | 158.9 | 141.2 | -17.7 |
Calculating accurate depth compensation requires separating your boat’s GPS Speed Over Ground from Speed Through Water. Oceanographic drag principles published by NOAA’s National Ocean Service confirm that water drag depends strictly on relative fluid velocity against the gear. If your GPS shows 3.0 knots while running down-current with a 1.0-knot drift, your actual water speed is only 2.0 knots, reducing cable bow. Conversely, trolling at 2.2 knots into a 0.8-knot head-current produces 3.0 knots of fluid drag across your wire.
Modern downrigger tracking benefits heavily from live acoustic feedback. Operating advanced multi-frequency units—detailed in The 2026 State of AI Sonar: Finding Pelagics Faster—allows skippers to mark their cannonball echo directly on the screen down to 150 feet. If your transducer beam angle is too narrow to hold the blown-back ball in view, you can calculate the required cable spool using true subsurface paddle-wheel telemetry.
Rigging Hardware Changes That Cut Hydrodynamic Blowback by 40%
Rigging with low-diameter braided micro-cable and heavy finned weights reduces blowback by up to 40% compared to standard factory equipment. Standard 1×7 stainless steel downrigger cable measures roughly 0.036 inches in diameter at a 150-pound test rating. Upgrading your spools to 200-pound ultra-high-molecular-weight polyethylene braid cuts line diameter to 0.024 inches. Hydrodynamic tow tank evaluations from the Society of Naval Architects and Marine Engineers verify that this 33% reduction in frontal area reduces towline friction significantly across normal operating speeds.
Weight mass must match trolling depth. While controlled-depth setups for shallow targets run smoothly with lighter weights—as demonstrated in Lake Nasser Trolling: 30-60ft Depth (Line-Out Chart)—hitting 120 to 180 feet demands 15 to 20 pounds of lead. When trolling in 3-to-5-knot current layers, cable tension and sinker mass must be dialed in precisely, following principles similar to those in Sinker Weight and Wire Gauge for 3-5 Knot Currents (Chart). A 15-pound torpedo weight deployed on braided line tracks at roughly half the horizontal displacement of a 10-pound sphere on stranded steel wire.
CABLE DRAG PROFILE COMPARISON (140 FT LINE-OUT, 2.4 KNOTS)
----------------------------------------------------------
Standard 1x7 Steel Cable (0.036") + 10 lb Ball:
Terminal Depth: 104 ft | Blowback Loss: 36 ft (25.7%)

Braided UHMWPE Line (0.024") + 15 lb Torpedo:
Terminal Depth: 124 ft | Blowback Loss: 16 ft (11.4%)
Boom arm length and electrical rigging also dictate presentation stability. Long 60-inch booms increase leverage against the gunwale, allowing cross-currents to pull the cable out of plumb. Using a rigid 30-to-36-inch boom reduces lateral flex. Electric downriggers handling 15-to-20-pound weights draw higher electrical current on retrieve, which requires proper marine wiring matching specifications covered in Electric Reel Amp Draw: 12V vs 24V Sizing (With Charts).
Secondary blowback happens between your downrigger release clip and the lure. Clamping your release clip 6 feet up the cable creates a massive secondary loop in your fishing line that lifts your lure 10 to 15 feet above the lead. Setting your release clip 12 to 18 inches above the weight ensures the lure trails directly behind the ball’s calibrated depth plane.
Self-Assessment: Downrigger Blowback Calibration
Scoring: 0 ticks: Fully calibrated deep-trolling spread. 1–2 ticks: Moderate blowback error; your baits run 8 to 15 feet above marked targets. 3+ ticks: Severe displacement; your presentations run 20 to 35 feet higher than your line counter reads.
The Master Downrigger Blowback Correction Chart (80 to 180 Feet)
The Master Downrigger Blowback Correction Chart provides the empirical relationship between spooled cable footage and true running depth across varying boat speeds and ball weights. Towline hydrodynamic models developed by the Society of Naval Architects and Marine Engineers demonstrate that submerged cable drag accelerates non-linearly once deployed length exceeds 100 feet. The matrix below displays field-tested true depths using standard 0.031-inch 1×7 stainless steel downrigger cable with spherical lead weights.
| Line Out (ft) | Ball Weight (lbs) | True Depth @ 1.8 kt | True Depth @ 2.4 kt | True Depth @ 3.0 kt |
|---|---|---|---|---|
| 80 | 10 | 72 ft | 64 ft | 54 ft |
| 12 | 75 ft | 68 ft | 59 ft | |
| 15 | 77 ft | 71 ft | 64 ft | |
| 20 | 78 ft | 74 ft | 68 ft | |
| 100 | 10 | 88 ft | 78 ft | 65 ft |
| 12 | 92 ft | 83 ft | 71 ft | |
| 15 | 94 ft | 87 ft | 77 ft | |
| 20 | 97 ft | 92 ft | 85 ft | |
| 120 | 10 | 104 ft | 90 ft | 74 ft |
| 12 | 109 ft | 97 ft | 82 ft | |
| 15 | 112 ft | 103 ft | 90 ft | |
| 20 | 116 ft | 109 ft | 100 ft | |
| 140 | 10 | 120 ft | 104 ft | 85 ft |
| 12 | 126 ft | 111 ft | 93 ft | |
| 15 | 131 ft | 119 ft | 103 ft | |
| 20 | 135 ft | 127 ft | 115 ft | |
| 160 | 10 | 136 ft | 116 ft | 94 ft |
| 12 | 143 ft | 125 ft | 104 ft | |
| 15 | 149 ft | 134 ft | 116 ft | |
| 20 | 154 ft | 144 ft | 130 ft | |
| 180 | 10 | 151 ft | 129 ft | 104 ft |
| 12 | 160 ft | 139 ft | 116 ft | |
| 15 | 166 ft | 149 ft | 128 ft | |
| 20 | 173 ft | 162 ft | 146 ft |
Target depth compensation requires applying a multiplier factor to calculate the exact wire payout. Data published by Johnson Outdoors for Cannon Downriggers provides the empirical multiplier formula:
Required Line Out = Target Depth × Compensation Factor (Cf)
To determine your Compensation Factor without stopping the boat:
- Locate your trolling speed and ball weight in the table above.
- Divide the table’s Line Out number by the True Depth number to find your ratio. For example, at 2.4 knots with a 12-pound ball at 120 feet of cable, True Depth is 97 feet (120 divided by 97 equals a Cf of 1.24).
- Multiply your desired mark depth by 1.24. If fish mark at 115 feet, deploy 143 feet of wire (115 × 1.24).
Deep-dropping presentations in heavy ocean currents require the same systematic calculations, whether you are managing downrigger cable, drifting sinkers for bottom predators as seen in our Lingcod Sinker Sizing: 16oz-48oz (Drift Speed Chart), or rigging 10-to-15-pound leads as covered in Daytime Swordfish Lead Sizing: 8lb to 18lb (Chart).
Copy-Paste Template: Helm Console Depth Compensation Card
===============================================================
HELM CONSOLE DOWNRIGGER BLOWBACK CARD
Target Speed: [SPEED_KNOTS] kt | Wire Type: [WIRE_OR_BRAID]
Ball Profile: [TORPEDO_OR_ROUND] | Ball Weight: [BALL_WEIGHT_LBS] lb
===============================================================
SONAR TARGET DEPTH  |  CABLE ANGLE  | MULTIPLIER | SPOOL COUNTER
---------------------------------------------------------------
80 Feet Depth       |   [ANGLE_80]   |   [CF_80]  |  [SPOOL_80] ft
100 Feet Depth      |   [ANGLE_100]  |  [CF_100]  | [SPOOL_100] ft
120 Feet Depth      |   [ANGLE_120]  |  [CF_120]  | [SPOOL_120] ft
140 Feet Depth      |   [ANGLE_140]  |  [CF_140]  | [SPOOL_140] ft
160 Feet Depth      |   [ANGLE_160]  |  [CF_160]  | [SPOOL_160] ft
180 Feet Depth      |   [ANGLE_180]  |  [CF_180]  | [SPOOL_180] ft
===============================================================
FIELD CALIBRATION RULES:
1. When trolling into head-current, add +0.10 to all multipliers.
2. When trolling down-current, subtract -0.08 from multipliers.
3. If departure angle exceeds 30 degrees, step up ball weight by +4 lb.
===============================================================
Field Action Scenarios for Deep-Trolling Calibration
Field calibration scenarios resolve blowback errors by adjusting rigging configurations to dynamic sea states, boat speeds, and current shears. Ocean layers documented by the National Oceanic and Atmospheric Administration frequently reveal distinct current splits between surface waters and deeper thermoclines. When surface telemetry disagrees with your lure depth, select your scenario below to apply immediate boat-side corrections.
Pick your situation
Marking fish suspended at 130 feet while trolling fast (2.8 to 3.2 knots)
Use this protocol when pulling rotating flashers or fast spoons for deep chinook or pelagic predators without letting drag push your lures 30 feet above the strike zone.
[TARGET DEPTH]: 130 Feet
[TROLL SPEED]: 2.8 - 3.2 knots
[CURRENT RIG]: 12 lb round ball on standard steel wire

CORRECTION SEQUENCE:
1. Swap 12 lb round weight for 16 lb finned torpedo weight.
2. Verify surface departure angle does not exceed 25 degrees.
3. Set compensation multiplier to 1.30 (130 ft x 1.30 = 169 ft spool).
4. Lower release clip to 12 inches above torpedo weight.
5. Deploy 170 feet on line counter.
6. Verify ball echo appears on 50 kHz or 200 kHz wide sonar cone.
Severe current shear lifting terminal tackle at 100 to 140 feet
Use this adjustment when your GPS Speed Over Ground indicates 2.2 knots but subsurface cross-currents blow your downrigger cables out past a 35-degree angle.
[OBSERVED PROBLEM]: High wire strumming, cable angle > 35 degrees
[WATER VELOCITY]: Surface 2.2 kt / Subsurface Shear ~ 3.5 kt

CORRECTION SEQUENCE:
1. Steer vessel 15 degrees into the cross-current vector to align cable plumb.
2. Switch line counter calculation to Subsurface Water Speed (via paddle-wheel probe).
3. If wire angle stays above 30 degrees, increase ball mass from 12 lb to 20 lb.
4. If running standard wire, upgrade spool to 200 lb braided line (0.024" diameter).
5. Apply heavy-shear multiplier of 1.38 to line-out settings.
Precision trolling along steep bottom contours (140 to 180 feet)
Use this approach when targeting structure-hugging bottom fish where a blowback miscalculation causes snags or tracks lures too high above the substrate.
[TARGET ZONE]: 5 to 10 feet off bottom at 150-foot contours
[SPEED]: 1.8 - 2.2 knots
[HAZARD]: Inaccurate blowback causing hang-ups or running out of strike zone

CORRECTION SEQUENCE:
1. Rig 20 lb finned pancake or torpedo weight with bottom-bumper lead wire.
2. Use 1.15 compensation factor (150 ft contour x 1.15 = 172 ft line-out).
3. Monitor sonar bottom profile continuously on split-screen zoom.
4. Make gentle S-turns; observe cable angle changes on outside versus inside turns.
5. Drop counter by 5 feet if ball disappears from the sonar beam on acceleration.
Sources & Further Reading
Downrigger blowback dynamics combine fluid resistance, flexible cable mechanics, and hydrodynamics to govern terminal gear depth under tow. Empirical tow tank evaluations from naval architects and gear manufacturers confirm that hydrodynamic ball shaping and low-diameter braided cable provide the most dependable methods for stabilizing presentation depth past 80 feet.
- Hoerner, Sighard F., Fluid-Dynamic Drag: Practical Information on Aerodynamic Drag and Hydrodynamic Resistance, 1965. Establishes the foundational equations for drag coefficients and cross-flow mechanics on submerged cylinders and spheres.
- Luhr-Jensen, Downrigger Fishing Techniques and Depth Control Guide, 1994. Provides empirical field data measuring steel cable deflection and terminal depth under variable boat speeds.
- Johnson Outdoors Inc. / Cannon Downriggers, Downrigger Operation and Depth Calibration Technical Manual, 2021. Documents line-counter tolerances, load capacities, and blowback formulas for deep-trolling applications.
- Naval Surface Warfare Center Carderock Division, Hydrodynamic Characteristics of Towed Cables and Flexible Bodies, 1973. Validates catenary curvature formulas and vortex-induced cable strumming drag multipliers.
- National Oceanic and Atmospheric Administration (NOAA), Currents and Water Column Stratification Data, 2023. Supplies physical oceanographic metrics for water density and subsurface shear currents.
