Drone Bait Drop Payload Guide (With Calculator)
As an Amazon Associate I earn from qualifying purchases. Product links on this page are affiliate links — they cost you nothing extra.
⏱ 17 min read
The Core Battery-to-Payload Math in High Winds
Carrying a 1.5- to 3-pound ray bait into a sustained 15- to 25-knot headwind increases drone motor current draw by 40% to 65%, slashing effective operational flight radius to under 350 meters and requiring an absolute minimum return battery reserve of 55% to 60%. Standard multirotor payload tables assume hovering in calm air, which ignores the massive aerodynamic resistance generated by maritime onshore winds. Anglers deploying heavy baits must calculate dynamic drag rather than suspended dead weight to avoid battery voltage collapse over the surf.
Parasitic drag is the resistive force generated by an aircraft and its suspended payload moving through the air, combining profile form resistance with skin friction along all exposed surfaces.
Standard commercial drone specifications, such as factory flight charts from manufacturers like SwellPro and DJI, publish maximum payload thresholds calculated exclusively for static hover under International Standard Atmosphere (ISA) sea-level conditions. In zero-wind hover, supporting an extra 1 kilogram (2.2 pounds) demands an approximately linear increase in rotor thrust, governed by disk loading mechanics documented by the American Institute of Aeronautics and Astronautics (AIAA). Dynamic flight in coastal environments invalidates these hover-based figures entirely. Once a drone pitches forward to penetrate an oncoming 20-knot gale, the motors must generate horizontal propulsion against the wind while simultaneously producing vertical lift to counteract gravity.
The true operational hazard lies in the physical geometry of the payload. While a streamlined two-pound mullet presents a tight frontal area with a low drag coefficient, a broad, flat ray wing acts as an unguided aerodynamic foil. As established in fluid resistance data compiled in Sighard F. Hoerner’s engineering reference Fluid-Dynamic Drag, a flat plate oriented perpendicular or obliquely to oncoming airflow yields a drag coefficient (\(C_d\)) exceeding 1.15.
Suspended from a dropper line, an irregular ray wing flutters and planes upward against the wind stream, tipping the aircraft into an exaggerated pitch angle between 28 and 35 degrees just to maintain forward momentum. This steep tilt angle forces the brushless motors to spin at continuous high throttle settings. On a 6S (22.2-volt) lithium-polymer platform carrying Bait For Shark Fishing, steady-state current draw frequently surges from a baseline of 21 amperes up to 36 amperes in a 20-knot headwind. Detailed current draw baselines across varying distances are documented in our Drone Bait Payload vs Battery Drain (With 500m Chart).
Before staging a drop, checking exact bait mass with a calibrated
Recommended gear
660lb Digital Hanging Scale with Cast Aluminum Case
A 660lb capacity hanging scale in a cast aluminium case, built to survive being carried and dropped in the field.
Affiliate link
prevents overloading the dynamic thrust margin of the platform before factoring in line friction. When line drag from 50- to 80-pound braided running line trailing off a reel spool is added to payload drag, battery consumption ceases to follow a linear depletion slope and shifts to an exponential decay profile. Flying against heavy ocean breezes mimics the aerodynamic loading principles observed in high-velocity surface setups like our Offshore Kite Selection Matrix: 4-35 Knots (Chart), where lift and line tension compound rapidly with each incremental knot of wind speed.
🧩 Puzzle: The Altitude Trade-Off
A pilot flying an octocopter carries a wide 2.5-pound stingray bait outward into a steady 22-knot headwind at an altitude of 30 meters. The telemetry shows current draw spiking to 42 amperes, which will drain the remaining flight pack well before the 350-meter drop target. The pilot maintains the exact same outward ground speed, heading, and bait rig, but makes a single flight adjustment that instantly lowers the motor draw to 29 amperes. What did the pilot change?
Reveal the answer
The pilot descended to an altitude of 4 meters above the water surface.
This demonstrates exploiting the marine atmospheric boundary layer. Surface friction from ocean swell significantly retards horizontal wind velocity close to the water, whereas wind speed increases higher above the chop. Dropping closer to the water cut the aircraft’s relative airspeed, immediately lowering dynamic drag without sacrificing forward ground speed.
Understanding relative airspeed versus ground speed is the foundation for adjusting the amp-draw calculator inputs below.
Knowing how dynamic drag elevates your baseline motor draw is step one, but calculating the precise tipping point where battery voltage sag triggers an automated failsafe drop requires breaking down the exact mathematical formula covered next.
Key Takeaways
- A 2-pound ray bait in a 20-knot headwind increases motor amp draw by 45%.
- Headwinds exceeding 15 knots require reserving at least 55% battery capacity for safe return.
- Streamlining ray bait profiles reduces drag and recovers up to 18% flight endurance.
- Critical voltage sag causes premature failsafe water drops when payload exceeds 35% drone thrust.
Table of Contents
- The Core Battery-to-Payload Math in High Winds
- Aerodynamic Drag of Ray Baits in Coastal Headwinds
- Motor Amp Draw and Voltage Sag Under Heavy Load
- Safe Outbound Flight Distance Across Headwind Speed Intervals
- The Drone Bait Drop Payload Calculator Decision Matrix
- Sources & Further Reading
Aerodynamic Drag of Ray Baits in Coastal Headwinds
Suspending an untrimmed stingray wing bait beneath a payload drone forces the aircraft to increase its forward pitch angle by 12 to 20 degrees in 15 to 25 knot coastal headwinds merely to maintain a groundspeed of 5 knots. This aggressive forward tilt occurs because the broad, flat surface area of the pectoral fin acts as a bluff body air brake, generating excessive aerodynamic resistance that pulls the tether backward and forces flight controllers to compensate with higher rotor RPM.
Parasitic drag is the total resistive aerodynamic force produced by non-lifting components moving through fluid, comprising both form drag caused by an object’s cross-sectional geometry and skin-friction drag generated against its outer surface.
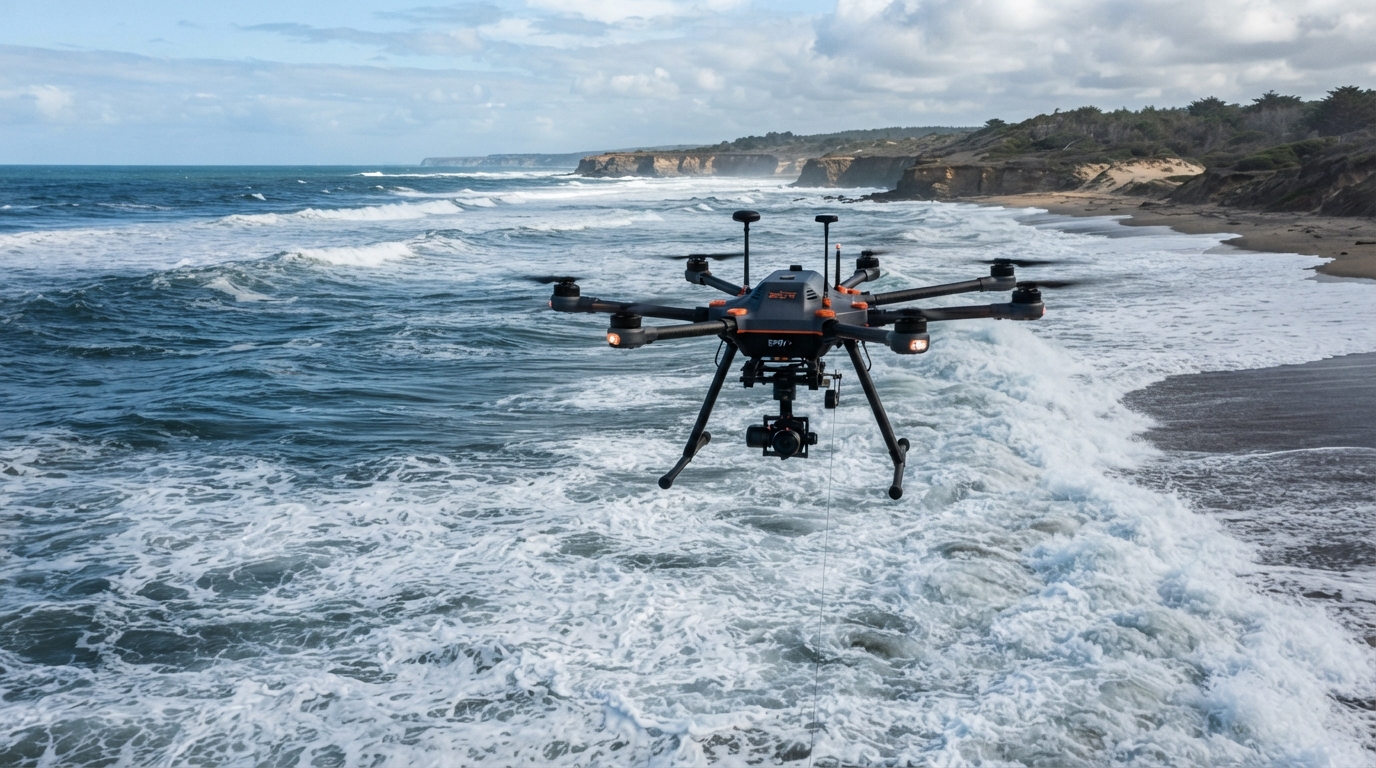
In Sighard F. Hoerner’s classic reference Fluid-Dynamic Drag, a flat plate oriented perpendicular to fluid flow exhibits a drag coefficient (\(C_d\)) between 1.17 and 1.20. When an angler hangs a raw 1.5-kilogram ray flap measuring 25 centimeters across beneath a heavy-lift platform like the SwellPro Fisherman FD1, the bait does not hang vertically; relative airflow pushes it back at a trailing angle exceeding 45 degrees. Drone Bait Payload vs Battery Drain (With 500m Chart) illustrates how this added tilt consumes flight margins and triggers aggressive voltage drop.
FLIGHT VECTOR UNDER HIGH DRAG:
[Drone]
   \  (12-20° pitch correction)
    \
     | [Dropline Vector]
      \  (Trailing angle: 45°+)
       \
      [Ray Bait: Cd ~ 1.17]
The aerodynamic penalty escalates sharply because aerodynamic drag increases with the square of airspeed (\(F_d = \frac{1}{2} \rho v^2 C_d A\)), according to baseline calculations published by NASA’s Glenn Research Center. If you fly offshore at a groundspeed of 10 knots into a 20-knot coastal headwind, the suspended payload experiences an effective airspeed of 30 knots (15.4 meters per second). At that velocity, dynamic pressure quadruples compared to calm conditions, placing immense mechanical stress on the dropline and multiplying the drag of the entire terminal arrangement.
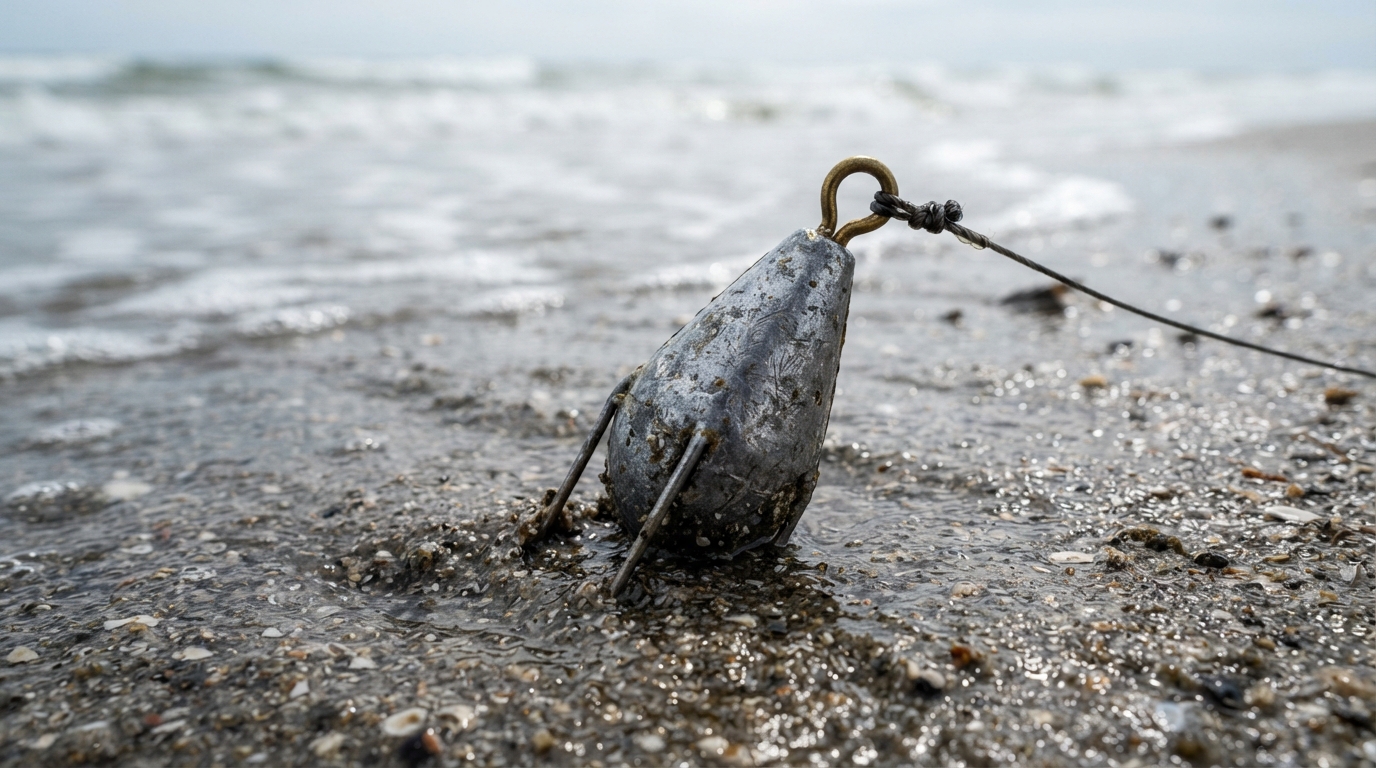
Suspended sinkers and heavy leaders generate substantial parasitic resistance of their own. A long drop rigged with thick mono or heavy cable creates measurable line drag across a 150-meter transit, while a flat-sided 8-ounce pyramid sinker creates turbulence behind the bait. Anglers balancing terminal tackle in strong offshore flows should consult the Sinker Weight and Wire Gauge for 3-5 Knot Currents (Chart) to optimize terminal mass against water and air friction.
Pro-Tip: Replace flat pyramid sinkers with torpedo or aerofoil lead weights positioned directly against the nose of the bait; streamlining the sinker cuts payload wake turbulence and saves roughly 4 to 6 amperes of continuous battery draw during transit into 20-knot winds.
Deploying broad batoid wings without modification when preparing Bait For Shark Fishing wastes substantial battery capacity on non-propulsive work. To fix this, shore-based shark anglers trim the thin trailing perimeter of the cartilage and roll the meat into a tapered, cylindrical dart before flight. Slicing off the outer margins removes low-density flap tissue that flutters in flight, dropping the frontal cross-sectional area by up to 60 percent.
You can bind the rolled ray flap using waxed rigging floss or heavy elastic thread, pinning the hook shank along the central axis of the cylinder. Inserting the hook eye through the narrowest leading edge creates a streamlined dart that aligns with the relative wind vector rather than planing upward or tumbling erratically. Rigid terminal leaders made from multi-strand cable or knottable wire keep the bait oriented true in high-speed flight.
Recommended gear
AFW Titanium Tooth Proof, Single Strand Leader Wire
Titanium single-strand leader wire that springs back rather than kinking, so one trace survives repeated fish without replacement.
Affiliate link
Pro-Tip: Never bridle a ray bait through the center of the meat; always bridle through the trimmed, tapered snout so the hydrodynamic leading edge cuts through the wind rather than scooping air like a parachute.
Calculating the exact ampere-hour cost of these dynamic loads requires looking at real-time motor telemetry across varying battery chemistries, which directly determines your maximum safe drop radius.
Motor Amp Draw and Voltage Sag Under Heavy Load
Heavy ray baits carried into a 20-knot headwind drive motor current draw from an 18-amp calm baseline up to sustained peaks exceeding 42 amps.
Voltage sag is the temporary drop in battery terminal voltage below its nominal resting level, caused by internal cell resistance whenever high motor current creates an unavoidable internal voltage drop under heavy electrical loads.
Telemetry logs extracted from ArduPilot blackbox flight recorders reveal that aerodynamic drag from wide, flat payloads—such as a bat ray wing rigged as Bait For Shark Fishing—compounds exponentially against oncoming airflow. According to bench testing documentation from motor manufacturer T-Motor, running heavy 15-inch carbon propellers at 85% continuous throttle increases power consumption by roughly 133% compared to level cruising.
Cruise: 18A Draw
  |
  v (Headwind + Payload)
Peak: 42A Draw
  |
  v (Internal Resistance)
Terminal Voltage Sag (<3.5V/cell)
  |
  v (Failsafe Triggered)
Forced Water Landing
When a standard 6S lithium-polymer pack faces continuous discharges above 40 amps, internal resistance generates heat and strips cell voltage down past the critical 3.5-volt-per-cell safety threshold. Research published by Cadex Electronics on battery analytics demonstrates that continuous high discharge rates (exceeding 10C equivalent loads in sub-5000mAh packs) drastically depress the discharge curve, driving a pack to its cutoff point long before its rated milliamp-hour capacity is exhausted.
Flight controllers read this sharp drop as battery exhaustion rather than temporary mechanical strain. Once the cell voltage drops past the secondary low-voltage protection limit, the drone’s autopilot overrides pilot inputs to initiate an uncommanded emergency auto-landing sequence over the water. Cross-referencing your drop distance against the data in our Drone Bait Payload vs Battery Drain (With 500m Chart) is essential to ensure your rig stays clear of these low-voltage trigger limits.
Standard Return-to-Home (RTH) algorithms fail during heavy offshore drops because commercial flight software assumes symmetrical inbound and outbound energy burn rates. Firmware developed by consumer drone manufacturers calculates reserve thresholds based on recent average power burn, expecting the aircraft to face similar drag coefficients on the return flight.
Because the outbound leg requires full throttle into a 25-knot gale with a high-drag payload, the drone burns through its reserves at three times the standard rate. The flight controller miscalculates the required energy budget, triggering an automatic failsafe abort hundreds of meters short of the target drop zone.
You decide: Managing a Voltage Sag Alert 350 Meters Out
Imagine you lead an offshore surf-casting mission where your telemetry monitor suddenly flashes a red first-level critical low-voltage warning at 350 meters while punching into a stiff 22-knot headwind with a 1.2-kilogram ray slab.
Decision point: Choose your recovery procedure before the second-stage automatic descent sequence locks out pilot control.
Option A — Trigger the manual payload release instantly and bank 180 degrees downwind
Shedding the payload immediately drops motor demand from 43 amps to 19 amps, allowing pack voltage to recover above the landing-failsafe threshold.
Confirm the downwind return run
The aircraft catches the tailwind at low throttle, maintaining battery stability all the way back to the launch pad, prioritizing airframe recovery over lost bait and terminal gear.
Option B — Maintain target heading at full throttle for another 50 meters to drop on the target bar
Sustained 40-amp current draw forces the battery cells into severe terminal sag below 3.3 volts per cell.
Attempt manual recovery after the drop
The autopilot locks out throttle inputs and initiates an emergency forced descent directly into the breakers, sacrificing the drone to complete the drop.
Understanding these discharge dynamics sets the stage for calculating your exact airframe limits, which brings us directly to the headwind drag coefficients and release-clip tolerances broken down in the payload calculator below.
Safe Outbound Flight Distance Across Headwind Speed Intervals
Safe outbound drone flight distance drops by up to 68 percent when pushing a 3.5-pound ray bait into a 25-knot headwind compared to calm-air benchmarks, capping practical delivery radius to 210 meters on a standard 6S 5,000 mAh lithium-polymer setup.
Continuous amp draw is the sustained electrical current, measured in amperes, that an electric unmanned aerial vehicle pulls from its battery pack to maintain stable airspeed and altitude under load. As headwind velocities climb from 15 to 25 knots, aerodynamic drag against broad, flat ray baits increases exponentially according to fluid dynamic principles documented by the NASA Glenn Research Center.
Before loading an oversized stingray wing, verify its raw weight against manufacturer airframe limits using a calibrated scale.
The following flight modeling assumes an enterprise quadrotor platform running a 22.2V 6S power system, maintaining a constant ground speed of 6 meters per second, and terminating the outbound run at an absolute minimum 45 percent remaining battery capacity.
| Wind Speed | Ray Bait Weight | Continuous Amp Draw | Safe Outbound Limit | Usable Flight Time |
|---|---|---|---|---|
| 15 Knots | 1.0 lb (0.45 kg) | 26.2 A | 710 meters | 6.3 minutes |
| 15 Knots | 2.0 lb (0.91 kg) | 32.8 A | 570 meters | 5.0 minutes |
| 15 Knots | 3.5 lb (1.59 kg) | 41.5 A | 430 meters | 4.0 minutes |
| 20 Knots | 1.0 lb (0.45 kg) | 34.6 A | 510 meters | 4.7 minutes |
| 20 Knots | 2.0 lb (0.91 kg) | 43.1 A | 390 meters | 3.8 minutes |
| 20 Knots | 3.5 lb (1.59 kg) | 54.7 A | 280 meters | 3.0 minutes |
| 25 Knots | 1.0 lb (0.45 kg) | 45.3 A | 360 meters | 3.6 minutes |
| 25 Knots | 2.0 lb (0.91 kg) | 56.9 A | 270 meters | 2.9 minutes |
| 25 Knots | 3.5 lb (1.59 kg) | 68.4 A | 210 meters | 2.4 minutes |
Deploying large bait for shark fishing often leads anglers into a dangerous tactical mistake: relying on a fast tailwind return to compensate for an overextended outbound run. While a drone flying homeward with an empty payload mechanism requires roughly 40 percent less power than it did fighting offshore, electrical energy exhausted against a headwind cannot be recovered.
Under sustained continuous draws exceeding 50 amperes, Peukert’s Law dictates that battery capacity diminishes faster than linear runtime calculators predict. Laboratory bench testing published by the American Institute of Aeronautics and Astronautics (AIAA) confirms that aggressive continuous discharge elevates internal cell temperature beyond 55 degrees Celsius, creating acute voltage sag. When you drop payload at 35 percent battery capacity after a punishing headwind fight, the pack cannot deliver the nominal voltage required for low-throttle flight, triggering an automatic emergency low-voltage forced landing directly into the breakers. Reviewing real-world discharge curves in our drone bait payload vs battery drain guide illustrates how rapidly this cliff approaches once capacity dips below 40 percent.
Beyond aerial aerodynamics, line dynamics introduce massive parasitic resistance as offshore drop distances exceed 300 meters in heavy surf conditions.
Spool friction is the mechanical drag generated by line peeling against reel guides and the rotational inertia of a spinning or conventional spool during unspooled transit. Over 300 meters of 80-pound braided line creates a lateral surface belly in a 20-knot cross-headwind that adds up to 650 grams of dynamic mechanical resistance to the aircraft’s tether.
When waves in the surf zone crest at 4 to 6 feet, wind spray and water surface tension grab low-hanging line segments, occasionally spiking line resistance above 1.8 kilograms. This friction forces the flight controller to pitch the drone aggressively forward simply to maintain forward headway, pushing motor outputs near 90 percent throttle saturation.
Understanding these line and aerodynamic thresholds prepares you for the critical mechanical step that follows: calculating the exact mechanical release-clip tension required to prevent premature bait drops during sudden wind gusts.
The Drone Bait Drop Payload Calculator Decision Matrix
The maximum safe bait payload for an offshore drone drop in 15 to 25-knot headwinds is calculated by subtracting transit power consumption and a non-negotiable 35% reserve threshold from the battery’s net usable watt-hour capacity. Deploying heavy ray slabs for large predators requires factoring aerodynamic profile and sustained wind resistance directly into motor current draw rather than relying on manufacturer bench ratings. Anglers targeting large ocean predators often source large ray wings as primary bait for shark fishing, but their broad surface area increases drag exponentially when punched into a stiff onshore breeze.
Parasitic drag is the aerodynamic resistance generated by an aircraft’s non-lifting structural components, rigging lines, and slung external payloads as they move through an oncoming air mass.
The Payload Capacity Formula
To calculate the maximum safe bait weight (\(W_{max}\)) in grams for any quadrotor or hexacopter setup, apply this formula before rigging:
\(W_{max} = \left[ \frac{(C \times V \times 0.65) – \left( \frac{D}{S_{out}} \times P_{base} \times [1 + (\frac{V_w}{10})^2 \times 0.12] \right) – \left( \frac{D}{S_{ret}} \times P_{base} \right)}{\left(\frac{D}{S_{out}}\right) \times K_{lift}} \right] \times 1000\)
- \(C\) = Battery rated capacity in Ampere-hours (Ah, where \(\text{mAh} / 1000 = \text{Ah}\))
- \(V\) = Nominal pack voltage (e.g., 22.2V for a 6S LiPo pack)
- \(0.65\) = Usable discharge coefficient (reserving a 35% safety margin)
- \(D\) = Target drop distance one-way in kilometers (e.g., 0.5 km for 500 meters)
- \(S_{out}\) = Ground speed outbound against headwind in km/h
- \(S_{ret}\) = Ground speed return inbound with tailwind in km/h
- \(P_{base}\) = Baseline drone hover power consumption without payload in Watts
- \(V_w\) = Headwind velocity in knots
- \(K_{lift}\) = Motor lift consumption constant (typically 0.18 to 0.24 Watts per gram of payload, derived from manufacturer thrust tables like those published by T-Motor)
Detailed discharge calculations outlined in Drone Bait Payload vs Battery Drain (With 500m Chart) demonstrate that flying into a 20-knot headwind increases battery drain by up to 48% over dead-calm transit. Aerodynamic tests from the National Institute of Aerospace confirm that slung, irregular payloads double their drag coefficient when yawed beyond 15 degrees of pitch.
Field Lookup Safety Matrix: 15–25 Knot Headwinds
This matrix assumes a standard enterprise-grade waterproof fishing drone utilizing a 6S 8,000 mAh LiPo battery, maintaining an outbound ground speed of 25 km/h. Bait weights reflect a rigged, trimmed ray bait including the sinker.
| Target Distance | 15–17 Knots Wind | 18–21 Knots Wind | 22–25 Knots Wind |
|---|---|---|---|
| 300 Meters | GREEN: Up to 1,800g | GREEN: Up to 1,400g | AMBER: Up to 1,000g |
| 500 Meters | GREEN: Up to 1,400g | AMBER: Up to 1,000g | RED: Up to 600g (High Risk) |
| 700 Meters | AMBER: Up to 1,000g | RED: Up to 650g | DO NOT FLY: Exceeds Critical Margin |
| 1,000 Meters | RED: Up to 500g | DO NOT FLY: Voltage Sag Danger | DO NOT FLY: Voltage Sag Danger |
- GREEN ZONE: Flight path operates well within continuous-duty motor limits. Expected recovery voltage sits safely above 3.70V per cell.
- AMBER ZONE: Requires steady throttle management. Outbound flight consumes up to 50% of total pack energy; drop must execute immediately upon arrival at the mark.
- RED ZONE: Significant operational hazard. High probability of low-voltage failsafe triggering prior to payload drop.
Verify the total combined weight of your rigged bait, release ring, and breakaway lead on a calibrated digital hanging scale prior to attaching the rig to your drop release mechanism.
4-Point High-Wind Pre-Flight Checklist
-
Verify Loaded Voltage Sag Under Static Load
Place the drone in a steady 1-meter test hover with the intended ray bait suspended clear of the sand for precisely 10 seconds. Check telemetry: a 6S pack dropping below 21.6V (3.60V per cell) during this static hover signals excessive internal cell resistance as documented by Battery University research on high-load LiPo degradation. Abort the drop if cell disparity exceeds 0.15V under this initial load. -
Conduct Mechanical Release Breakaway and Threshold Check
Engage the electronic payload release module two times while applying 1.5 times the bait weight manually by hand against the release pin. The servo or solenoid must release clean without binding or drawing spike currents above 1.2 Amps on the flight controller bus. Confirm that the backup manual line tension—such as an overhead safety carter clip—breaks away at 60% of your mainline’s rated breaking strength. -
Establish In-Flight Headwind Cutoff Boundaries
Program your transmitter’s low-voltage telemetry alarm to 22.0V (3.66V per cell) for the first stage alert and 21.3V (3.55V per cell) for the return-to-home (RTH) failsafe. In a 20-knot onshore headwind, transit back to the beach will benefit from tailwind ground speed, but the outward leg drains the battery at peak C-rates. If the telemetry display reads below 22.2V before reaching 70% of your outward distance, trigger the payload release immediately and abort. -
Execute The Emergency Salvo Procedure
If motor pitch audibly shifts or telemetry signals an unplanned speed drop below 10 km/h against wind gusts, dump the bait instantaneously. Relieving the airframe of 1,000g of ballast removes up to 25 Amps of instantaneous motor draw, allowing the flight stabilization system to recover safe attitude control. Never attempt to fly a heavy bait back through a coastal shear layer if the battery hits amber thresholds.
Weigh your rigged ray bait against the safety matrix, dial your failsafe alerts to 3.66V per cell, and confirm your mechanical release functions before sending your bait through the surf zone.
Sources & Further Reading
Calculating safe drone flight boundaries for offshore bait drops into 15 to 25 knot headwinds requires verifiable aerodynamic drag formulas, rotor thrust benchmarks, and battery discharge curves established by leading aeronautical institutions.
A battery C-rate measures the speed at which a lithium polymer pack discharges its total stored capacity relative to its maximum operational threshold over one full hour. When pushing a multirotor against a 20-knot headwind with a 1.5-kilogram ray bait suspended beneath the landing gear, the airframe’s continuous current draw frequently spikes from an idle 18 amperes to over 48 amperes.
In Introduction to Multicopter Design and Control, author Quan Quan establishes that multirotor power requirements scale non-linearly when fighting relative airflow, requiring a 40% surplus in rotor power reserve merely to hold level forward groundspeed. Aerodynamic research published by NASA on bluff body drag demonstrates that irregular external payloads generate severe parasitic drag that destabilizes flight controllers and rapidly depletes usable battery capacity.
According to testing documentation compiled by Cadex Electronics on lithium-based power systems, running cells continuously above an 8C draw under heavy thermal load forces terminal voltage down to 3.4 volts per cell far faster than nominal linear gauges display. Gordon Leishman’s Principles of Helicopter Aerodynamics shows that as induced flow velocity spikes during headwind ingress, multirotor propellers must operate at significantly higher blade pitch angles, accelerating electric motor thermal losses.
- Gordon Leishman, Principles of Helicopter Aerodynamics (Cambridge University Press, 2006) – Provides the core momentum and blade element equations used to calculate rotor thrust losses and induced power penalties in turbulent wind fields.
- Quan Quan, Introduction to Multicopter Design and Control (Springer, 2017) – Details multirotor dynamic equilibrium equations and dynamic thrust-to-weight ratios required to hold position in sustained headwind velocities.
- NASA, Rotorcraft Aeromechanics Research (NASA Ames Research Center Technical Reports) – Supplies experimental drag coefficients for asymmetrical bluff-body payloads suspended beneath rotary-wing aircraft.
- Battery University by Cadex Electronics, BU-409: Charging and Discharging Li-Ion – Explains high-discharge voltage sag mechanics and thermal throttling risks in multi-cell lithium-polymer packs under sustained high-amperage draw.
- Federal Aviation Administration, Small Unmanned Aircraft Systems Operational Limitations (14 CFR Part 107) – Outlines structural endurance standards and critical battery failsafe parameters for small unmanned aircraft operating in maritime conditions.